- Handwara leads with highest Voter turnout at 72%
- Gurez Records Lowest at 40.82%
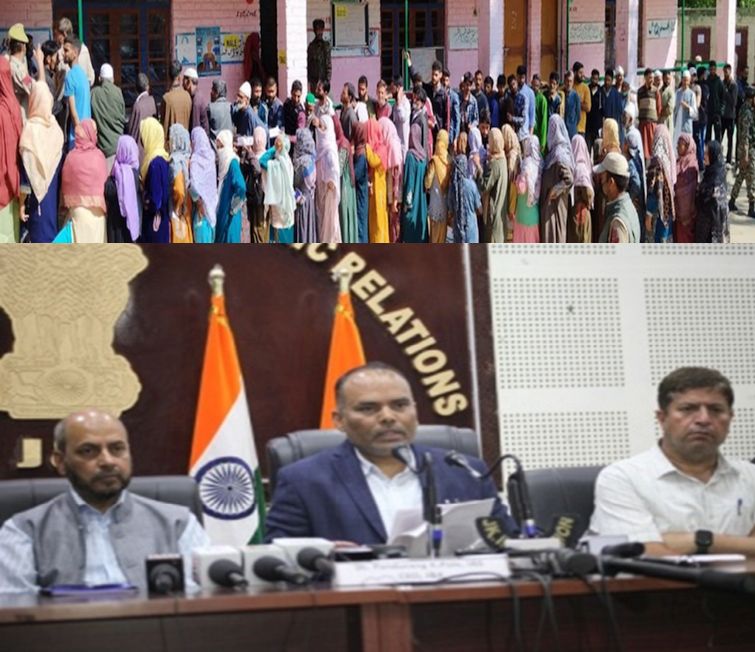
Baramulla: Chief Electoral Officer of Jammu and Kashmir, Pandurang Kondbarao Pole, announced on Monday that the Baramulla Parliamentary constituency witnessed a remarkable 59% voter turnout, marking the second-highest in its history of democratic elections.
Speaking to reporters in Srinagar, Pole lauded the people of Baramulla for achieving the highest-ever poll percentage for the parliamentary seat, ensuring a violence-free election day. He noted that the previous highest voter turnout in the Baramulla Lok Sabha constituency was recorded in 1984 at 58.90%, slightly lower than this year’s 59%.
The Baramulla Parliamentary constituency’s turnout of approximately 59% is the highest since its establishment in 1967, surpassing the initial turnout of 51.35%. Data from the CEO’s office revealed varying percentages in previous elections, with notable figures including 61.09% in 1984 and 27.79% in 1999.
Pole emphasized the meticulous arrangements, including CCTV surveillance at all 2,103 polling stations, which ensured smooth proceedings despite some reports of slow polling. He highlighted that this year’s turnout, though the second-highest in history, might emerge as the highest once final figures are tallied, especially considering recent delimitation changes.
Significant turnouts were noted in various areas, such as Sopore’s improvement to 44% from previous single-digit figures. Highlighting specific turnout percentages by the close of polls, Pole mentioned figures like 66.76% in Handwara and 39.77% in Gurez, showcasing diverse engagement across assembly segments.
“This year’s elections were conducted without any boycott calls or intimidation, showcasing the voters’ unwavering belief in the power of the ballot,” Pole stated. “Not a single polling station reported zero votes, a testament to the widespread enthusiasm and commitment to the democratic process.” He added that the corresponding percentage for the last Lok Sabha election in 2019 was 37.41%.
Pole noted that the highest-ever poll percentage in the Baramulla Parliamentary Constituency since the eruption of terrorism in Kashmir was recorded in 1996 with 46.65%. However, the highest poll percentage in its history was approximately 61.09% in 1984. “This year’s poll percentage is definitely the second highest in the democratic history of Baramulla PC and may be the highest as final figures are yet to come in from remote areas. With the recent addition of the Budgam and Beerwah assembly segments, it is likely the highest for the Baramulla PC in today’s size,” he added.
The Chief Electoral Officer congratulated all voters and expressed gratitude towards those who participated in large numbers. He also appreciated the efforts of all polling personnel, security personnel, police officers, AROs, ROs, and District Election Officers for their service in making the elections successful.
The assembly segment-wise voter turnout at the close of polls reflected varying levels of participation. Handwara emerged as the segment with the highest voter engagement, recording approximately 72%, indicating robust civic involvement. Conversely, Gurez reported the lowest turnout at 40.82%, highlighting potential challenges or lower mobilization efforts in that area. Other segments such as Karnah, Trehgam, and Uri also demonstrated notable engagement, with turnout percentages around the 60% mark, showcasing significant commitment to the democratic process. Overall, the constituency witnessed an approximate voter turnout of 58.62% by the close of polls, reaffirming considerable civic participation.
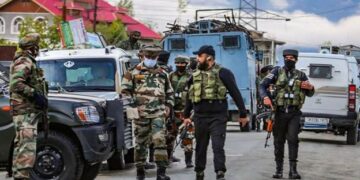
Officials attributed the increased polling percentage to improved security and law-and-order environments over the last 4-5 years, mobilization by 22 candidates and political parties, election awareness campaigns by Deputy Commissioners and the CEO office through SVEEP activities, and a strong voter belief in the ballot as a means to sustainable development.
Polling took place in 2,103 polling stations across the Baramulla Parliamentary constituency with live webcasting at all stations. Voting started at 7 a.m. with long queues of enthusiastic voters waiting to cast their votes. Elderlies, ladies, and youths were seen enthusiastically exercising their right to vote in a peaceful environment.
Chief Electoral Officer PK Pole monitored the progress of voting in Phase V from the Union Territory-level Command and Control Center established at ICCC-HMT, Bemina, and the CEO Office in Srinagar. The Command and Control center has been working 24/7 in Srinagar and Jammu since March 16 to ensure free, fair, and inducement-free elections.
Approximately 1,737,865 electors were enrolled, with more than 8,000 polling staff performing duties. Polling continued until 6:00 p.m., with some stations in Trehgam extending until the last voter in line cast their vote. Basic facilities such as water, electricity, toilets, ramps, and waiting areas were provided at every polling station. Efforts were made to enhance the voter experience, including wheelchairs and volunteers as needed. Additionally, 18 “pink” polling stations managed by women, 17 polling stations managed by specially-abled persons, and 18 polling stations managed by youths were established to ensure inclusive voting.
Assembly Segment-Wise Voter Turnout
| Assembly Segment | Poll % at 5:00 PM | Close of Poll (Tentative) | |
| Karnah | 56.65% | 61.87% | |
| Trehgam | 57.31% | 62.56% | |
| Kupwara | 55.68% | 60.29% | |
| Lolab | 55.72% | 58.00% | |
| Handwara | 66.76% | 72.00% | |
| Langet | 60.08% | 66.05% | |
| Sopore | 40.10% | 44.36% | |
| Rafiyabad | 54.69% | 57.39% | |
| Uri | 59.07% | 62.92% | |
| Baramulla | 48.20% | 52.15% | |
| Gulmarg | 54.45% | 59.52% | |
| Wagoora–Kareeri | 47.10% | 49.79% | |
| Pattan | 52.90% | 60.01% | |
| Sonawari | 58.64% | 64.73% | |
| Bandipur | 56.13% | 60.24% | |
| Gurez | 39.77% | 40.82% | |
| Beerwah | 55.62% | 58.80% | |
| Budgam | 48.12% | 52.00% |
| Sr. no | Year | Baramulla PC |
| 1 | 2019 | 37.41 |
| 2 | 2014 | 38.96 |
| 3 | 2009 | 41.84 |
| 4 | 2004 | 35.65 |
| 5 | 1999 | 27.79 |
| 6 | 1998 | 41.94 |
| 7 | 1996 | 46.65 |
| 8 | 1991 | No election held, due to turmoil |
| 9 | 1989 | 5.48 |
| 10 | 1984 | 61.09 |
| 11 | 1980 | 56.02 |
| 12 | 1977 | 56.97 |
| 13 | 1971 | 50.62 |
| 14 | 1967 | 51.35 |

